
Career Guides
How many jobs should you apply to in 2026?
Most answers hand you a number with nothing behind it. This one shows the arithmetic: the measured conversion rate at each stage in 2026, a worked calculation that targets one offer, and a weekly plan for four common situations. Updated 15 September 2026.
How many jobs should I apply to?
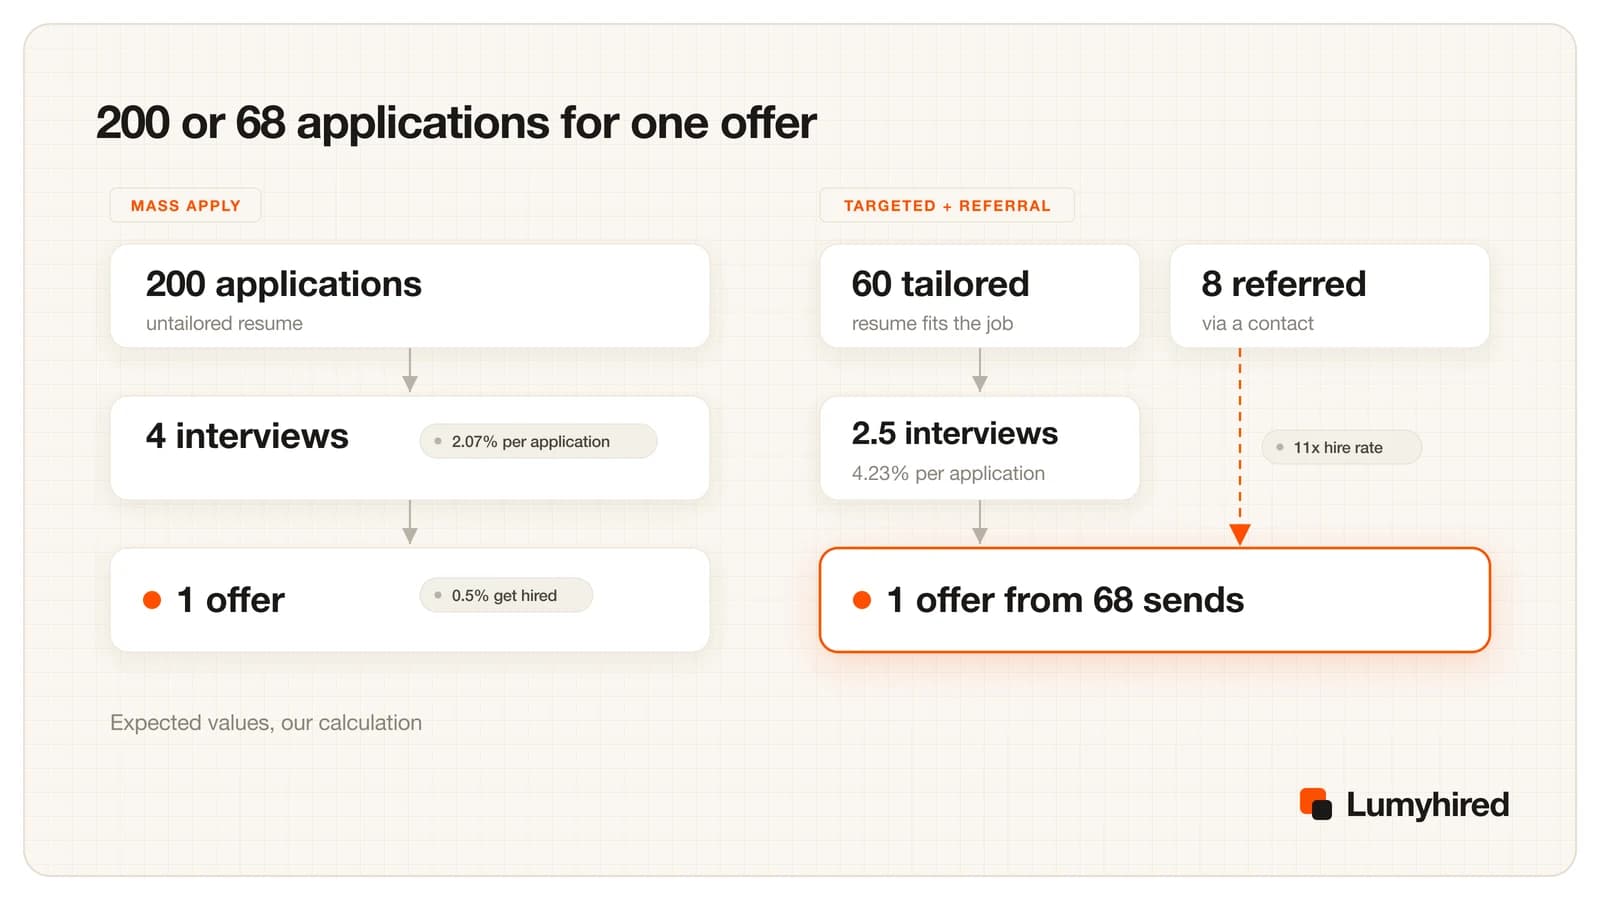
Budget about 200 applications per offer if you send the same resume everywhere. Gem’s 2026 benchmarks, built on more than 165 million applications and 1.2 million hires, put the applicant-to-offer rate at 0.5%. Tailoring roughly doubles the interview rate, 4.23% against 2.07% in Huntr’s Q1 2026 data, which brings the estimate to about 98. Add referred applications, which Gem measured converting at 11 times the inbound rate, and 60 tailored applications plus 8 referred ones reaches one expected offer. In practice that is 5 to 10 tailored applications a week plus one referral every week or two, sustained for the 11.4 weeks that US unemployment lasted at the median in August 2026.
Conversion figures come from vendor ATS datasets (Gem, Huntr, Greenhouse, Ashby) and the US Bureau of Labor Statistics. The 98 and 68 figures are our calculation, shown step by step below. Data read 15 September 2026.
How many applications does it take to get a job in 2026?
Two numbers answer this from opposite sides. From the employer side, Gem’s 2026 Recruiting Benchmarks (published December 2025, covering 165 million applications and 1.2 million hires from June 2021 to May 2025) found that 0.5% of applicants receive an offer, which works out to roughly one hire per 200 applications. The rate splits by company size: 0.3% at small companies, 0.7% at large ones. Only 8% of applicants get past the first screen.
From the candidate side, Huntr’s 2025 annual report tracked 1.78 million applications from more than 57,000 job seekers. Among those who landed an offer, 16% had sent 11 to 20 applications, 14% had sent 21 to 30, 38% had sent 30 or fewer in total, and 18% had sent more than 100. The spread is the finding. Anyone quoting a single number is describing one slice of that distribution.
Keep the two measures apart. Ashby’s May 2026 release reported an average of more than 300 applications per hire, three times the 2021 level, which counts everyone who applied to a job. Your own count is different: it is how many applications you personally send before one of them converts. The employer-side rate is what you should use as a starting probability per send, and the candidate-side distribution is what tells you how widely real outcomes vary around it.
The math: how many applications for one offer?
The calculation has one formula and three inputs. Applications needed = offers wanted ÷ (interview rate × interview-to-offer rate).
Input one, the interview rate. Huntr’s Q1 2026 report (139,927 applications from 25,635 seekers) measured 4.23% of applications with a tailored resume producing an interview, against 2.07% without. That is one interview per 24 tailored applications, or one per 48 untailored.
Input two, the interview-to-offer rate. No public dataset publishes this for candidates. We derived it: Gem’s 0.5% offer rate divided by Huntr’s 2.07% untailored interview rate gives about 24%, roughly one offer per four interviews. Label it “our calculation” wherever you reuse it. It combines an employer-side dataset with a candidate-side one, and the two measure different populations. We also assume an interview won with a tailored resume closes at the same rate as any other interview, which no source tests.
Input three, the referral lane. Gem found referrals converting at 11 times the rate of inbound applicants. Applied to the 0.5% baseline that is about 5.5% per referred application, or one offer per 18. The figure slightly overstates the lane, because the 0.5% baseline already includes referred candidates.
| Approach | Applications | Expected interviews | Expected offers |
|---|---|---|---|
| Same resume everywhere | 200 | 4.1 | 1.0 |
| Tailored to each posting | 98 | 4.1 | 1.0 |
| Tailored plus a referral lane | 60 tailored and 8 referred | 2.5 plus the referral lane | 1.05 |
One caveat carries more weight than any of the inputs: an expected offer is an average, and you get a whole number of offers. If your plan produces one expected offer and applications are treated as independent events, the chance of finishing with at least one is about 63%. Planning for two expected offers takes that to roughly 86%. That is the honest reason to aim above the minimum the arithmetic allows.
How many applications per interview in 2026?
The stage rates below are what the arithmetic runs on. Everything except the last row comes from datasets published by companies that sell hiring or job-search products, which is worth knowing when you compare them with your own numbers.
| Measure | Rate | Applications per result | Source and sample |
|---|---|---|---|
| Interview, tailored resume | 4.23% | 24 | Huntr Q1 2026, 139,927 applications |
| Interview, untailored resume | 2.07% | 48 | Huntr Q1 2026, same sample |
| Conversion, tailored resume, full year 2025 | 5.8% against 3.73% | 17 against 27 | Huntr 2025, 1.78M applications |
| Past the employer’s first screen | 8% | 13 | Gem 2026, 165M+ applications |
| Offer | 0.5% | 200 | Gem 2026, 1.2M hires |
| Callback with a tailored cover letter | 16.4%, against 12.5% generic and 10.7% with none | 6 | ResumeGo, 7,287 fictitious applications, 2019 to 2020 |
Where you apply moves the rate as well. Huntr’s 2025 data recorded response rates of 11.3% through Google Jobs, 4.5% on Indeed and 3.1% on LinkedIn. Those are responses of any kind rather than interviews, and board mix reflects who uses that tracker, so read them as a reason to vary your sources rather than as a ranking.
The practical consequence is that the tailoring step has a bigger effect on your required volume than any decision about how many applications to send. Halving the number you send while tailoring the resume to each posting holds your expected interviews steady and gives back the hours.
Does applying to more jobs get you more interviews?
In absolute terms, yes, and at a falling rate. Huntr’s Q1 2026 data shows seekers who sent 11 to 20 applications in total getting an interview on 9.25% of them, while seekers who sent more than 100 got one on 2.58%, which is 3.5 times lower.
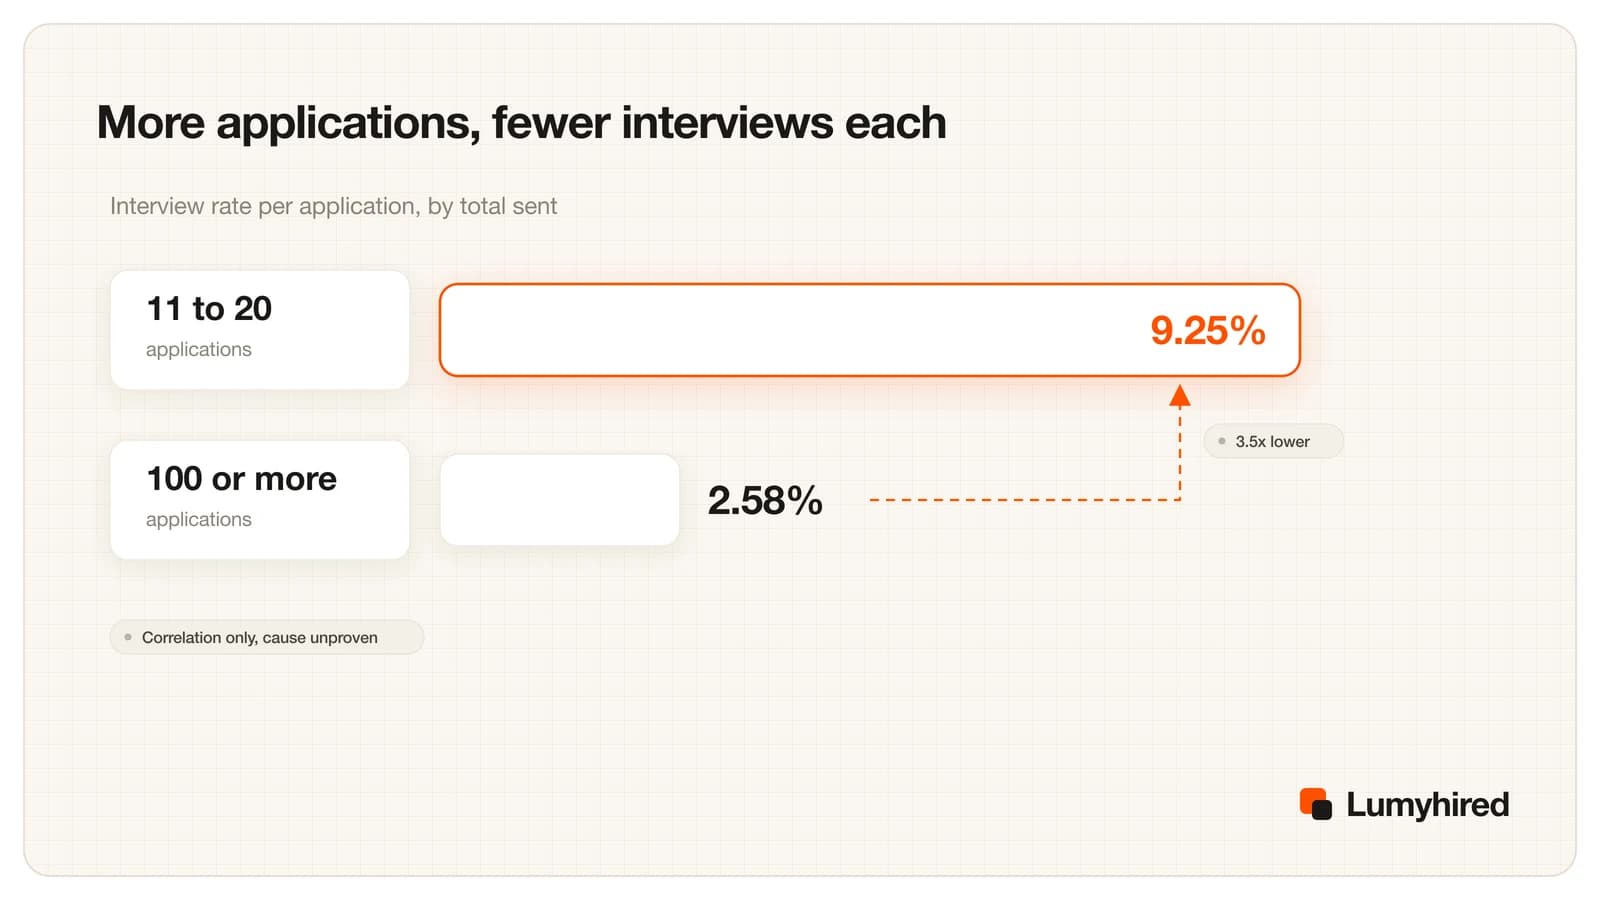
Read that as a correlation. Two mechanisms explain most of it without any causal claim. People who get interviews early stop applying, so the 11 to 20 group is full of searches that worked quickly, while the 100+ group collects the searches that were failing and kept going. And time per application drops as the count rises, so high-volume sending is usually also lower-effort sending.
The absolute numbers still favour some volume: 15 applications at 9.25% gives about 1.4 interviews, 100 applications at 2.58% gives about 2.6. More sending buys more interviews, at a worse exchange rate each time.
There is a useful stopping rule in the same figures. At the 4.23% tailored rate, sending 50 applications with zero interviews happens about 12% of the time; at the 2.07% untailored rate, about 35%. So a long silence after untailored sending is ordinary, while 50 tailored applications with nothing back points upstream, to the reasons applications get no response or to which jobs you are targeting in the first place.
Why each application is worth less than it was in 2022
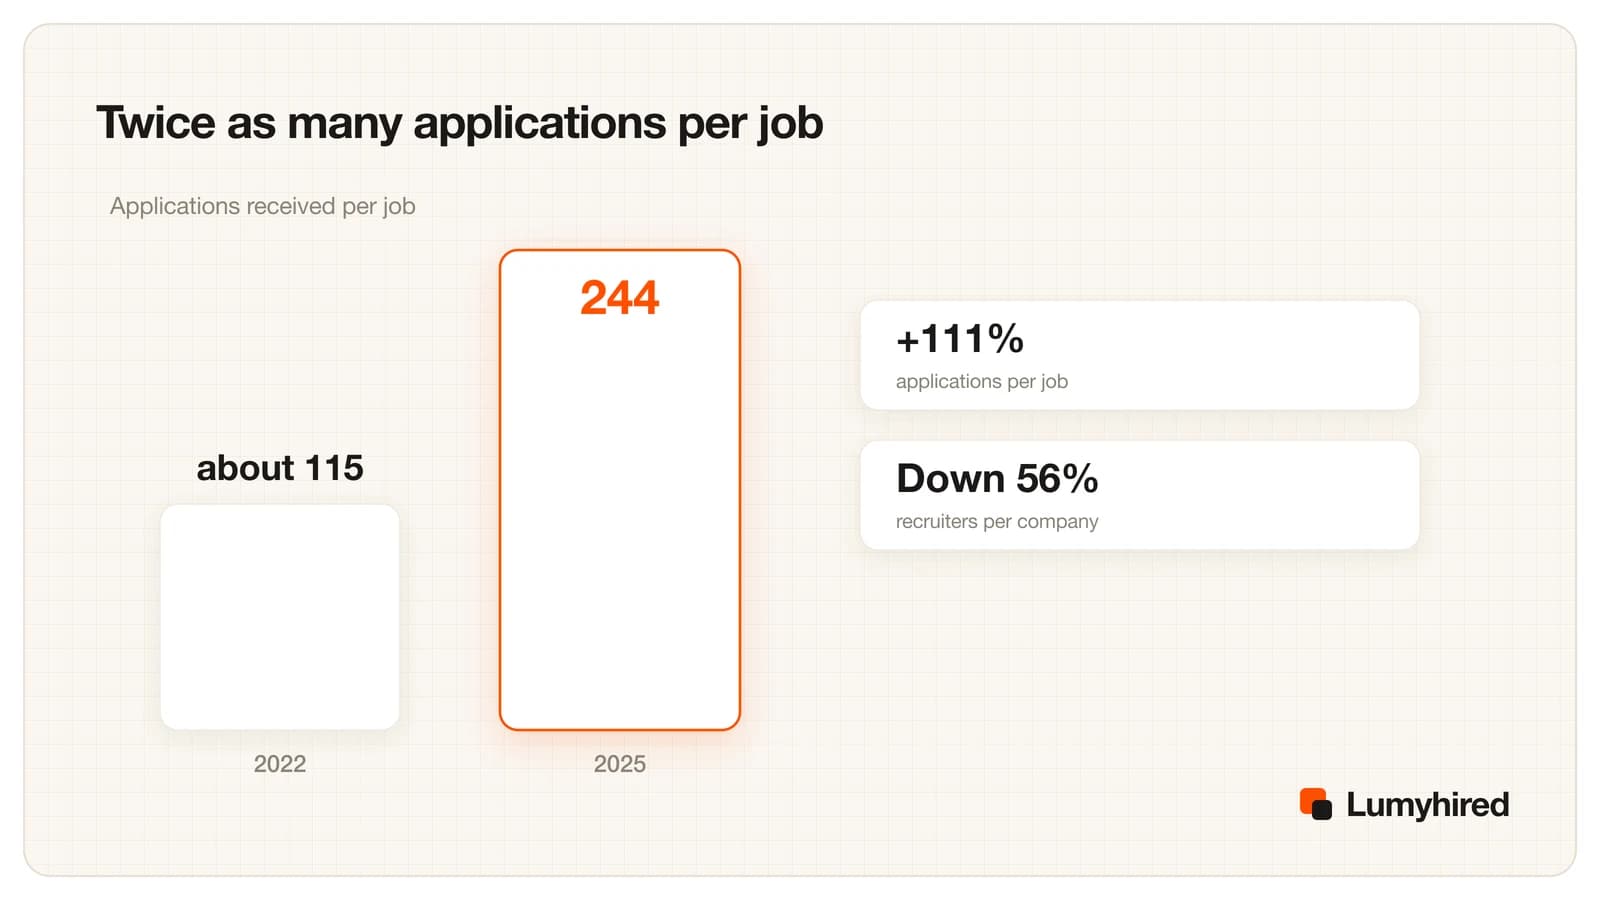
Greenhouse’s 2026 hiring benchmarks, drawn from more than 6,000 companies and 640 million applications, recorded 244 applications per job in 2025 against about 115 in 2022, a 111% rise. Over the same period applications per recruiter rose about 411% while recruiters per company fell 56%, and time to fill stretched to 59.67 days, up 37%.
Ashby’s May 2026 data puts the candidate-side consequence plainly: applicants are about 50% less likely to get an interview than they were five years ago. Part of the flood is automated. Greenhouse’s 2025 survey of 2,200 people in the US, UK and Ireland found 22% using bots to auto-apply, rising to 31% among Gen Z, and 67% using AI tools somewhere in their search.
There is early evidence that this erodes the value of the signal itself. A September 2025 working paper by Cui, Dias and Ye studied a large online labour platform after it launched an AI cover-letter tool. Letters matched job posts more closely and callbacks rose, yet the link between how well a letter matched and whether it got a callback fell by 51%, with employers shifting weight onto work history. The paper covers freelance work rather than salaried roles and has not been peer reviewed, so read it as a direction rather than a measurement. The practical version: tools that send applications for you raise your send count in a market where send counts have already doubled.
How long does a job search take in 2026?
The US Bureau of Labor Statistics put median unemployment duration at 11.4 weeks in August 2026, up from 9.9 weeks a year earlier, with an unemployment rate of 4.1% (released 4 September 2026). The mean was 26.3 weeks, far above the median, because 1.9 million people, 27.0% of the unemployed, had been looking for 27 weeks or more.
Huntr’s tracker users reported a median 108 days to a first offer in Q1 2026, up from 83 days in Q4 2025. Those two medians measure different things, one being time out of work and the other time from starting a tracked search to an offer, and both landed between three and four months.
Size the plan for the mean rather than the median. A search that runs past three months needs a pace you can hold and, if you are out of work, a clear account of the period, which is its own piece of preparation: how to explain a career gap.
How many applications per day or per week? A plan by situation
The figure repeated most often online, 10 to 15 applications a week, comes from guidance published in 2024 with no outcome data attached to it. The plans below start from the measured rates instead and aim for close to two expected offers where the search is urgent, since one expected offer only carries a 63% chance of landing one.
| Situation | Tailored per week | Referred applications | Horizon | Expected offers | Chance of at least one |
|---|---|---|---|---|---|
| Employed, searching on the side | 5 | 1 every two weeks | 16 weeks | 1.26 | 72% |
| Unemployed, searching full time | 10 | 1 per week | 12 weeks | 1.89 | 85% |
| New graduate | 12 | 1 every two weeks | 12 weeks | 1.80 | 83% |
| Career changer | 3 | 1 per week | 16 weeks | 1.37 | 75% |
Employed. Five tailored applications a week is what an evening schedule holds without the quality slipping, and the 16-week horizon matches Huntr’s 108-day median to a first offer. The referral lane matters more here than volume does, because you can only send so much.
Unemployed. Two tailored applications per working day, plus one referred application a week, over 12 weeks. The horizon comes from the 11.4-week BLS median, and the plan aims near two expected offers because the cost of a fourth month is high.
New graduate. Higher volume, thinner referral lane. Entry-level postings are more numerous and more interchangeable, and a new graduate has fewer people who can refer them, so the numbers shift toward sending. No dataset we trust splits interview rates by seniority, so this row uses the same rates as the others, which is a limitation rather than a finding.
Career changer. The inverse. A resume written in another field’s vocabulary matches fewer of the posting’s terms, so the per-application rate is probably below the 4.23% average, and the referral lane is where a person can vouch for transferable work that a filter will not see. That reasoning is ours; we found no dataset that measures conversion for career changers specifically.
After about 30 applications you can stop borrowing our numbers. Divide your interviews by your applications, put your own rate into the formula, and the required volume falls out. That only works if you recorded what you sent and where, which is the case for keeping an application tracker from the first week. If you are weighing whole approaches rather than weekly counts, the ranking of job search strategies covers the same decision at the level above.
Referrals move the application-to-offer ratio
Gem measured referred candidates converting at 11 times the rate of inbound applicants, and sourced candidates being about 8 times more likely to be hired. Ashby’s benchmarks show referred candidates passing the first screen 52% of the time against 35% overall.
Keep the volumes in view too. In Ashby’s data on roughly 250,000 hires, referrals accounted for a steady 17% to 18% of hires while inbound applications produced 52% of hires in Q2 2025. Applying online is still how half of all hiring happens. Referrals give you the better exchange rate on a small number of sends, while the inbound lane still supplies most of the hires.
In plan terms, one referred application is worth about five tailored ones (5.5% against 1.02% per application, our calculation). That is the argument for spending an hour a week on contacts at target companies rather than on ten more sends, and it is covered in more depth in job search strategies beyond applying online.
Ghosting: when to follow up and when to move on
Silence is the normal outcome of an application. Greenhouse’s 2025 workforce report, a survey of 2,200 people in the US, UK and Ireland, found 63% of candidates left without news after interviews, rising to 78% among Gen Z. Half of the candidates surveyed said they had ghosted an employer in turn.
Ashby’s recruiting operations benchmarks give the timing behind the silence: candidates rejected without an interview were archived after 6 days, and candidates who did interview after 21 days. That sets two reasonable follow-up points. One short message about a week after applying, when the decision has usually already been taken but a named contact can still surface your file. One after an interview at the two-week mark, then treat three weeks of silence as a no for planning purposes while leaving the door open.
The planning point matters more than the etiquette. Applications you are waiting on should not reduce the number you send this week. The weekly plan assumes a constant rate, and a week spent waiting is a week of expected offers you did not buy.
Frequently asked questions
How many jobs should I apply to per day?
Is 100 applications a lot?
What is a good application to interview ratio?
What is the application to offer ratio in 2026?
Why am I applying to so many jobs and getting no interviews?
How long should I wait before following up on an application?
Do auto-apply tools help me hit the number?
How long does it take to find a job in 2026?
Where Lumyhired fits in this plan
The arithmetic on this page rests on two levers: tailoring each application, and knowing your own conversion rate instead of ours. Lumyhired covers both. It rewrites your resume against each posting before you send it, searches 10+ job boards so the targeting happens before the sending, and records every application in a tracker so that after 30 sends you can compute your real interview rate. Before any of that, run the document through the ATS resume checker and read the text a parser gets back. Weekly plans start at €5 on the pricing page, with a 3-day money-back guarantee and cancellation at any time. There is no free plan.
Sources
- Gem, 2026 Recruiting Benchmarks (December 2025), 165M+ applications and 1.2M hires, June 2021 to May 2025. gem.com
- Huntr, Job Search Trends Q1 2026, 139,927 applications from 25,635 seekers plus a survey of 593. huntr.co
- Huntr, 2025 Annual Job Search Trends Report (December 2025), 1.78M applications from 57,000+ seekers. huntr.co
- Greenhouse, Hiring Benchmarks 2026 (May 2026), 6,000+ companies and 640M+ applications. greenhouse.com
- Ashby, Recruiting Operations Benchmarks (2026), 54M+ applications across 93,000 jobs, and the May 2026 release on rising selectivity. ashbyhq.com
- Ashby, Inbound Hires report (2025), about 250,000 hires from 2021 to June 2025. ashbyhq.com
- US Bureau of Labor Statistics, Employment Situation, Table A-12, August 2026 (released 4 September 2026). bls.gov
- Greenhouse, 2025 Workforce & Hiring Report (17 July 2025), survey of 2,200 people in the US, UK and Ireland. prnewswire.com
- ResumeGo, cover letter field experiment, 7,287 fictitious applications, July 2019 to January 2020. resumego.net
- Cui, Dias and Ye, arXiv 2509.25054 (September 2025, revised November 2025), AI cover letters on an online labour platform. Working paper, not peer reviewed. arxiv.org
Read next
- Why You're Not Getting Interviews in 2026
Diagnose it by symptom: no replies, rejections within minutes, screens with no interviews, interviews with no offers, or silence. A 10-minute test for each.
- How to Tailor Your Resume to a Job Description
A 15-minute method with three before and after bullets, an AI prompt that forbids invented facts, and Huntr's data: tailored resumes got interviews at 4.23% vs 2.07% in Q1 2026.
- Job Search Strategies 2026: Which Channels Get Interviews
Interview rates by job board and career page, referral vs cold application, five message templates and a 10-hour weekly plan built from 2026 data.